
 Open Access
 Abstract
The study examines the effect of public spending from many perspectives on economic growth and vice versa in Dong Thap province. The Granger causality theory and the VAR autoregressive vector model of real GDP (GDPR) were used to test the causal relationship between public spending and provincial economic growth. Time series data from 1995 to 2020 were collected from Dong Thap Provincial Statistics Office. The research results show that: aggregate public expenditure has no Granger relationship with GRDP but is significant in the opposite direction; GRDP has a positive effect on overall public spending - economic growth increases the scale of public spending; development investment spending has no Granger relationship with GRDP but recurrent spending has a positive effect on GRDP. However, in the opposite direction, GRDP does not have a Granger relationship with recurrent expenditure but has a Granger relationship with development investment spending. The study also found that private investment and growth in labor size have a positive effect on GRDP. The author has proposed a number of significant solution groups based on the investigation’s findings. The first solution is to allocate budget resources so that the recurrent expenditure proportion can account for an increasing proportion in the structure of public expenditure. The second option is to create an environment that encourages private investment. For instance, perfecting mechanisms and policies on attracting private investment; socializing, attracting, and establishing favorable conditions for the private sector to participate in the delivery of public services; encouraging and assisting the private sector to make investments in cutting-edge research, development, and technology transfer. The third option is to put more of an emphasis on human resource development, with a particular emphasis on educating top-notch human resources to meet the province's development needs. In the upcoming years, boosting training and labor support services through procedures and policies as well as financial support from the budget will also have a significant positive impact on output volume.
Introduction
Economic growth is the core issue that each locality seeks to maintain and promote. In each economic cycle, economic growth is affected by many different factors. In order to ensure a sustainable growth rate, the primary concern of the provincial government is to mobilize resources for growth Economy. In particular, financial resources, precisely budget expenditure, are one of the key factors for the province's comprehensive economic growth and development. Public spending is one of the two key tools of fiscal policy helping the government intervene in the economy. However, the economic efficiency of public spending is still controversial.
There have been many studies, both in theory and practice, on the impact of budget expenditure on economic growth, and they have given different results. Theoretically, there are three opposing views regarding this issue: for, against, and a third view that the impact of government spending on economic growth depends on the size of government spending government-as a share of government spending over total economic output. When government spending is small, the positive effect outweighs its negative impact. When government spending becomes large, the negative impact on economic growth will increase.
In practice, the research results also provide evidence to support all three theoretical views. Studies that find adverse effects of government spending on economic growth include Hoang, Fölster and Henrekson 1 , 2 . On the contrary, many studies show a positive relationship between government spending and economic growth: Nguyen, Su, 3 , 4 , 5 , 6 . There is also evidence to support the existence of an optimal size of government spending that gives the highest growth rates, which can be found in Forte and Magazino's study 7 , 8 .
Therefore, balancing the appropriate supply of public goods and services while ensuring growth targets while maintaining public debt and a reasonable tax burden is a complicated and challenging task. Therefore, solutions for public spending toward local economic growth are essential and urgent. This is where the government can intervene directly. Exploring the impact of budget spending on local economic growth will be a helpful reference channel to help the government make relevant policy decisions and create economic incentives.
Dong Thap is the watershed province of the Mekong Delta region, with the starting point of being the agricultural land with the third largest total rice production in the country. Up to now, the province has expanded spectacularly to both the public and private sectors: industry, commerce - services. As a result, the economic prosperity of Dong Thap will greatly impact the general development of the Mekong Delta and the entire nation. According to the General Statistics Office (2021), the average GRDP growth of Dong Thap province reached 6.5% in the period from 2011-2019. Due to the impact of the Covid pandemic, the GRDP growth of Dong Thap province reached only 2.69% in 2020 and -1.76% in 2021. However, Dong Thap province's GRDP per capita continuously increased tremendously over the years. In 2000, it was only 3.41 million VND/person, but by 2021, it rose to 54.47 million VND/person. The economic structure continues to shift positively, and the quality of growth has been improving and deepening.
According to the Dong Thap Finance Department, the province's entire local budget expenditures from 2016 to 2020 totaled VND 59,485 billion. Local budget spending increased at a 9.09%/year rate. The ratio of budget expenditure to GRDP in the 2016-2020 period is on average 16.24%/year, increasing by 1.06% compared to the 2011-2015 period 9 . Dong Thap province's public spending structure has changed, specifically, increasing gradually proportion of investment and development expenditures and declining recurrent expenditure proportion. Dong Thap Finance Department announced that the average annual percentage of investment spending was 22.66% from 2011 to 2015 and grew to 24.02% from 2016 to 2020. The average share of recurrent expenses has decreased in line with it, from 75.73%/year in the period 2011-2015 to 69.62% in the period 2016-2020 9 .
Finding research on how public spending affected provincial economic growth was a tough challenge. Along with the the inconsistent results of this relationship, there was a need for a study to assess the effectiveness of raising budget expenditure as well as changing the proportion of public expenditure structure in Dong Thap province in recent years, in order to provide a basis for solutions to support the province's economic growth.
Study overview
Related Concepts
Public expenditures are government levels, administrative units, and non-business units controlled and funded by the government. Thus, public expenditures are mainly those of the state budget approved by the National Assembly.
Vu and Mai generalized expenditures in the provincial and district budgets divided into three major categories, including: development investment expenditures (total construction expenditures and other development investment expenditures), expenditures regular expenditures (expenditures for health, education, administration, security and defense, non-business, science and technology), other expenditures (provincial level includes the remaining expenditures minus additional expenditures for the state budget) 10 , 11 . At the lower level, such as: paying principal, and spending on target programs; at the district level, the remaining expenses other than investment and recurrent expenditures. However, spending on development or recurrent expenditure is only relative; for example, recurrent expenditure on education is an investment in human capital with long-term benefits 12 .
Economic growth - the increase in real GDP over time, equal to the increase in national income. If there is an increase in the level of real national income from year to year, it can be said that the economy has grown. However, if the population grows by the same percentage, per capita income will not increase. Therefore, to be precise, measure the increase in real (per capita) national income. This measure of the increase in economic activity is known as economic growth. Economic growth is simply a measurement of the change in a country's national output, gross domestic product (GDP), or gross national income (GNI) 13 .
Foundation Theory
The production function is a function that represents the dependence of output on inputs. The Cobb-Douglas production function is a type of production function discovered by Cobb (the mathematician) and Douglas (the economist). The production function is usually put in Cobb-Douglas form as follows:
Y = AL α K β ,
in there:
Y = output
L = number of labor input
K = amount of capital
A = total factor productivity
α and β are the output elasticities of labor and capital, respectively; they are fixed and determined by technology 14 .
Economic theory often does not explicitly state the impact of government spending on economic growth. However, most economists agree that, in some cases, a reduction in government spending can boost economic growth and, in other cases, increase government spending. Government is beneficial to economic growth.
According to the theory of Keynes, increasing public spending increases national income and economic growth 15 . Keynes argued that an increase in public spending, i.e., an increase in investment in the public sector, increases national income exponentially. Public expenditure is the independent variable, and national income is the dependent variable.
Wagner's theory carried out research in several industrialized countries 16 . The basic assumption of Wagner's law is that public spending growth is tied to output growth. Wagner implies that due to increased output, enormous public spending is good. Thus, as income increases, public spending increases, but at a faster rate.
Thus, Wagner and Keynesian theories on the relationship between public spending and economic growth are opposite 17 .
The demand-driven growth theory lies within the Macroeconomic Growth Theory based on the Keynesian principle of effective demand. Under the demand-led growth theory, the economy's capacity to increase output is in response to the increase in effective demand, which is contrary to the classical growth theory.
The government-led growth theory states that government spending is thought to be both a stimulus to capital investment and a source of demand for social spending. The theory, therefore, favors government spending on public goods that enhance productivity and that economic growth goes hand-in-hand with social progress.
Research Methodology
In the least squares or fixed regression, only the independent variable affects the dependent variable; in many cases, the dependent variable affects the independent variable, so we have to use using VAR autoregression model to estimate their influence. The vector autoregression (VAR) model was first put forth by Christopher Sims in 1980, and it is now one of the most popular techniques in macro-empirical research.
The model that considers many time series simultaneously is called the VAR(p) model (p is the maximum delay): this is a system of equations. The VAR model allows us to consider variables that interact with each other (all of which can be endogenous variables); the model has the form:
In there:
The purposes of the VAR(p) model are:
• Building predictive models without theory.
• Allowing consideration of the dynamic effect of a shock on other variables
• Allowing an assessment of the significance of a shock to the variability of variables.
• Providing the basis for performing the Granger causality test to examine the interplay between variables.
The VAR model has p being the maximum lag of any variable. VAR can have m variables (m > 2). Each of the m variables has its equation in the whole system of equations.
In the VAR model without the above constraint, each variable appears with each lag in all equations. With a VAR(p) model with m variables, there will be m 2 coefficients at each delay; the VAR model has many coefficients. The random errors (disturbances) of the VAR are white noise vectors. Any dynamic relationship will be expressed through the coefficients of VAR. Each random error cannot be predicted from the past – either from its own past or another error. This increases the ability to estimate the parameters in the VAR system. The delay p must be chosen so there is no autocorrelation between the estimation errors.
However, the condition of VAR is that the time series must be stationary; in practice, the original data series are usually non-stationary. We often pass through the wrong data series to arrive at the stationary series.
The research model is set up based on the neoclassical production function and the hypotheses about the independent variables as inputs to output (GRDP). However, theory and previous studies also show that these variables interact with each other. Sims, Dang & Bui, and Su said that if there is a concurrent relationship between some variables, these variables have the same role, there is no distinction between endogenous and exogenous variables. Previous authors have introduced VAR autoregression model 18 , 19 , 6 . VAR is a dynamic model of several time variables.
Not only studying the one-way effect of public spending on economic growth, the author also wants to take into account how other variables—such as investment spending, regular spending, economic growth, etc.—relate to one another. Owing to the aforementioned reasons, this study is conducted using the time series analytic approach and a multi-series autoregressive vector model (VAR).
From the theoretical research model, we based on the empirical studies to select the representative variables to give the experimental model. These representative variables are detailed in Table 1 .
Research models
GRDP t = α 0 + α 1 DIE t + α 2 RES t + α 3 PI t +α 4 L t +α 5 TIE t + ε t
The study analyzed the relationship between variables using Granger causality theory and VAR autoregressive vector model of GDP.
The research data used is secondary research data, including time series data from 1995 to 2020 collected by the Dong Thap Provincial Statistics Office. The calculated data is reprocessed for estimation.
This study used Eviews 10 software to analyze descriptive statistics and regression.
Results
Descriptive statistics
After the data has been collected and calculated, the results are presented in the descriptive statistics table in Table 2 . The results show the range, mean and standard deviation of the variables used in the model.
Result of unit root test
For time series, it is always assumed that the movement trend of past and present data is maintained for future periods. To eliminate spurious regression results, the data must show a tendency to fluctuate around a fixed mean over the long term. To test the stationarity of time series variables, the traditional Augmented Dickey-Fuller (ADF) is tested with the assumption:
H 0 : = 0 => conclusion: The series has a unit root or a non-stationary series.
H 1 : < 0 => conclusion: There is no unit root or stationary series in the series.
Suppose the t-stat statistic (included in the model) has a negative value greater than 5% of the DF table lookup value in the Augmented Dickey-Fuller test. In that case, hypothesis H 0 is rejected, or the variable is stationary or absent Unit experience 6 . As seen in Table 3 , the model's variables are stationarity-checked.
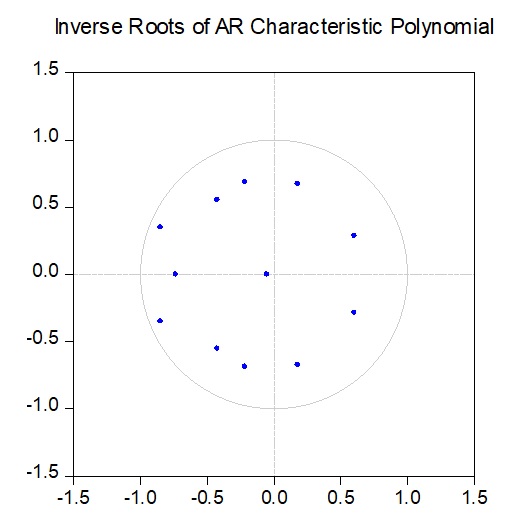
Next, the author tests the stability of the VAR model, Figure 1 shows that all solutions are reasonably stable within the unit circle, none of which are outside the range of the circle.
At the same time, the model also meets the stability through the results in Table 4 . Therefore, this is a favorable condition for the author to conduct Granger causality test in the following section.
Granger causality test results
With the variable overall public expenditure
The following Table 5 provides a summary of the findings from testing the Granger relationship between the set of exogenous variables and the model's dependent variable:
Research results show that: Overall Public Expenditure (TPE) has no Granger relationship with GRDP. But GRDP has Granger relationship with TPE with statistical significance level of 1%.
To choose the appropriate delay for the model, it is necessary to consider the criteria LR, FPE, AIC, SC, and HQ in the following table:
Based on the results presented in Table 6 , the optimal delay of the VAR model is selected to be 2.
With the variable expenditure by structure
In order to be able to make assessments more detailed, the author conducts more testing models on the relationship between economic growth and public spending, separated by a structure including development investment expenditures (DIE) and recurrent expenditure (RES). The implementation process is similar to the steps of the model with the overall expenditure variable. After testing the stationarity to eliminate spurious time series regression, the author performs a latency test based on the criteria AIC, SC, HQ. The results in Table 7 show that the optimal lag selected for the VAR model is 2. Thus, the model is very suitable for performing the Granger test between endogenous and exogenous variables.
The results of Granger causality test are shown in Table 8 : After testing the stationarity and choosing the lag of the model, the author performs Granger causality test.
The results of testing the Granger relationship among the variables in the VAR model show that:
+ DIE has no Granger relationship with GRDP, but RES has a Granger relationship with GRDP at 1% significance level.
+ However, in the opposite direction, GRDP has no Granger relationship with RES but has a Granger relationship with DIE at 1% significance level.
The study also found:
+ PI has a positive effect on GRDP at 1% significance level, and L also has a Granger relationship with GRDP at 5% significance level.
Discussion
This study examines the effect of public spending from many angles on economic growth and vice versa in Dong Thap province. Granger causality theory is used to test the causal relationship between public spending and the economic growth of the province in the period 1996 - 2020. The results of the empirical study allow us to draw some main conclusions as follows:
First, GRDP has a Granger relationship with overall public expenditure at the 1% significance level, but not vice versa. It means that economic growth increases the size of public spending (similar to the research results of Nguyen, and Akonji, but overall public spending does not make the local economy grow 5 , 17 ). Therefore, a key duty to secure public spending is to maintain the growth of the GRDP. However, overall public spending does not make the local economic growth increase. This outcome differs from the majority of earlier research on the influence of public spending on economic growth. Therefore, it should be given top importance to assess the efficiency of public spending in Dong Thap.
Second, In the structure of public expenditure, recurrent spending (RES) has a Granger relationship with GRDP at 1% significance level, meaning that an increase in recurrent spending positively affects economic growth (Similar results with the study of Grullón, Akonji, Dang and Bui, but not vice versa 17 , 18 , 25 ). Meanwhile, GRDP has a Granger relationship with DIE at the 1% significance level. However, it does not have the opposite direction, meaning that in the short run, the increase in investment expenditures has no contribution to local economic growth.
Third , Private investment has a positive impact on economic growth (consistent with the research results of Nguyen, Dang and Bui, Hussein & Benin, Phetsavong & Ichihashi, Su 6 , 18 , 26 , 27 , 28 ). In terms of enhancing the province's investment environment, Dong Thap is one of the shining examples of the Mekong Delta and the entire nation. Thanks to the investment environment consistently upgraded to meet development requirements and economic sectors encouraged to actively and confidently devote capital to business, the economic growth was promoted.
Fourth, Labor size growth has a positive impact on economic growth (same result as Bui Quang Binh, Su, Hussein & Benin, Phetsavong & Ichihashi, opposite to the results of Dang and Bui 6 , 18 , 26 , 28 , 29 . The labor size of Dong Thap province was increasing greatly, especially the rate of trained workers went up continuously from 58.2% in 2016 to 70% in 2020, of which vocational training increased from 42% to 50% compared to the province's labor force. The business community has given the favorable reviews to the quality of education and training provided to employees in Dong Thap as they were improved significantly. The expansion of human capital, both in quantity and quality, contributed to the economic success of Dong Thap. The major pathway for growth in the upcoming years was the combination of suitable capital and labor to the province's conditions.
Fifth, There is no relationship between trade openness and economic growth in Dong Thap province. This result is contrary to Dang and Bui, Su study 6 , 18 . This outcome can be as a result of Dong Thap's low export turnover and minimal contribution to the province's economic expansion.
Conclusion
According to research findings, Dong Thap province's recent economic growth has been fueled by recurring rather than investment expenditure. The province of Dong Thap's economy is growing favorably as a result of private investment and labor force size. Several policy consequences are discussed below in light of this conclusion:
(i) Dong Thap province needs to allocate budget resources so that the proportion of recurrent expenditure accounts for an increasing proportion.
Akonji has suggested that the structure of government spending in some countries is making the mistake of allocating too many public resources to investment expenditures. This makes them inefficient compared to public expenditures 17 . Frequent, Dang and Bui and Grullón also argue that recurrent expenditures contribute to economic growth rather than investment expenditures 18 , 25 .
After reviewing the experimental results in Dong Thap from 1995 to 2020, the study also had the same opinion as above. The author proposes that Dong Thap province should orient the budget allocation so that recurrent expenditure could accounts for an increasing proportion of the structure of public expenditure.
(ii) Create a favorable environment to attract private investment.
When assessing the impact of investment capital on the economic growth of provinces in the Mekong Delta in the period 2010–2017, Nguyen pointed out that private investment has the strongest impact on economic growth in the capital structure 27 . Empirical results have clarified the positive impact of private investment on the economic growth of Dong Thap province. Therefore, macroeconomic managers need to take drastic measures to promote the further development of the private economy. The leading group of solutions are: creating a favorable investment and business environment for the private economy to develop; completing mechanisms and policies on attracting private investment; socializing, attracting and creating conditions for the private sector to participate in providing public services; encouraging the private sector to invest in advanced research, development and technology transfer activities.
(iii) Improve the quality of human resources
According to Bui, labor is still an essential resource in the output growth of the economy 29 . The labor force is the factor in carrying out the work of national construction and development. An increasing labor force will be a good source of labor for economic development jobs.
Based on the findings of the study, the author makes suggestions for how to deal with the challenging labor-related issues that businesses face in order to support economic output growth. Focusing on human resource development; prioritizing the training of high-quality human resources to meet the province's development needs; expanding the scope and methods of training human resources, and enhancing training and labor support services through budgetary support in the upcoming years will all have a significant positive impact on output are all included in this group of solutions.
Limitations
Only 25 observations were conducted for the time series data from 1995 to 2020, and it is also challenging to control data quality. The research model also lacks many other macro-variables that could affect the province's economic growth. The aforementioned reasons may affect the reliability of the research results. In addition, studies on the impact of public spending on economic growth are often national or transnational. This study analyzes the impact of public spending on economic growth within a province. Therefore, inheriting previous studies and solving problems cannot be expected.
List of Abbreviations
ADF: Augmented Dickey-Fuller
DIE: Development Investment expenditures
GDPR: Gross Domestic Product Real
GNI: Gross National Income
L: Labor size growth
PI: Private investment
RES: Recurrent Expenses
TIE: Total import-export turnover/GDP
USD: United States dollar
VAR: Vector Autorewardsion
VND: VietNam dong
ACKNOWLEDGEMENT
This work belongs to the project grant No: T2022-13 funded by Ho Chi Minh City University of Technology and Education, Vietnam.
CONFLICT OF INTEREST
The authors hereby declare that there is no conflict of interest in the publication of this article.
AUTHORS’ CONTRIBUTION
Le Thi Tuyet Thanh is in charge of evaluating the theoretical underpinnings, providing an overview of the state of earlier investigations, and suggesting policy implications based on the findings. Choosing estimate techniques, gathering and processing data, and analyzing regression findings are all the responsibilities of Dang Quang Vang.
References
- Fölster S, Henrekson M. Growth effects of government expenditures and taxation in rich countries. European economic review 2001; 45(8):1501-1520. . ;:. Google Scholar
- Hoang KL. The relationship between public spending and economic growth in the period 2008-2012. VNU Scientific Journal: Economics and Business 2016; 32(3): 10-17. . ;:. Google Scholar
- Corray A. Government expenditures, governance and economic growth. Comparative Economic Studies 2009; 51 (3): 401-418. . ;:. Google Scholar
- Alexiou C. Unraveling the mystery between public expenditures and growth: Empirical evidence from Greece. International Journal of Economics 2007; 1(1): 21-31. . ;:. Google Scholar
- Nguyen HH, Nguyen VP, Nguyen TD. Using time series analysis model, examine the relationship between public expenditure and some socio-economic indicators in Ho Chi Minh City. Journal of Science and Technology Development - Economics, Law and Management 2019; 3(1): 68- 84. . ;:. Google Scholar
- Su DT. Public spending and economic growth in Vietnam, testing causality in a multivariate model. Economic Development Journal 2011; 252: 54 - 61. . ;:. Google Scholar
- Chobanov D, Mladenova A. What is the optimum size of government', Institute for Market Economics, Bulgaria 2009; 1-47. . ;:. Google Scholar
- Forte F, Magazino C. Optimal size of government and economic growth in EU-27. Centro di Ricerca Interdipartimentale di Economia delle Istituzioni 2010; 4(2010): 1-47. . ;:. Google Scholar
- Dong Thap Department of Finance. Report on assessment of the implementation of budget revenue and expenditure in the period 2016-2020 and the 5-year financial-budgetary plan for the period 2021-2025: Dong Thap; 2020. . ;:. Google Scholar
- Mai DL. The impact of fiscal decentralization on economic growth in Vietnam [PhD. Thesic]. University of Economics Ho Chi Minh City. Ho Chi Minh; 2012. . ;:. Google Scholar
- Vu TNP. Textbook of development economics. Hanoi: Labor and Social Publishing House; 2005. . ;:. Google Scholar
- Perkins DH, Radelet S, Lindauer DL. Economics of Development. 6th Edition. Norton, W. W. & Company, Inc; 2006. . ;:. Google Scholar
- Blink J, Dorton I. Economics course companion: IB diploma grogramme. Oxford: Oxford University Press; 2007. . ;:. Google Scholar
- Cobb CW, Douglas PH. A theory of production. The American Economic Review 1928; 18(1): 139-165. . ;:. Google Scholar
- Keynes JM. The General Theory of Employment, Interest and Money. Journal of the American Statistical Association 1936; 31(196): 791-795. . ;:. Google Scholar
- Wagner A. Three Extracts on Public Finance. In: Classics in the theory of public finance. Palgrave Macmillan, London: 1958; 1-15. . ;:. Google Scholar
- Akonji DR, Olateju AO, Abba MW. Nexus between public expenditure and economic growth by testing Wagner's law time series: Evidence from Nigeria. International Journal of Development and Sustainability 2013; 2(4): 383 - 395. . ;:. Google Scholar
- Dang VC, Bui TH. The impact of public spending on economic growth: Evidence of chain data in Ho Chi Minh City. Ho Chi Minh. Journal of Development and Integration 2014;18(28): 27 - 33. . ;:. Google Scholar
- Sims C. A. Macroeconomics and reality. Econometrica: journal of the Econometric Society 1980; 1-48. . ;:. Google Scholar
- Muhammad S. Impact of Globalization on HDI (Human Development Index): Case Study of Pakistan. European Journal of Social Sciences 2010. 13. Accessed 1 July 2015. . ;:. Google Scholar
- Mukherjee S. Is there any Relationship between Environment, Human Development, Political and Governance Regimes? Evidences from a Cross-Country Analysis. National Institute of Public Finance and Policy (NIPFP), New Delhi, Indian Institute of Foreign Trade (IIFT), New Delhi 2010. . ;:. Google Scholar
- Davies A. Human Development and the Optimal Size of Government. Journal of Socioeconomics 2009; 35: 868 - 876. . ;:. Google Scholar
- Su DT. Threshold effect on spending and economic growth in Vietnam tested by Bootstrap method. Economic Development Journal 2013; 268: 12-22. . ;:. Google Scholar
- Akinlo AE. Government spending and national income nexus for Nigeria. Global Journal of Business Research 2013; 7(1): 33-41. . ;:. Google Scholar
- Grullón S. National income and government spending: Co-integration and causality results for selected Latin American countries. International Journal of Economics, Commerce and Management 2014; 2(4):1 - 9. . ;:. Google Scholar
- Hussein J, Benhin J. Public and private investment and economic development in Iraq (1970-2010). International Journal of Social Science and Humanity 2015; 5(9): 743. . ;:. Google Scholar
- Nguyen TTK, Nguyen NQ, Nguyen PH. Impact of capital investment on the economic growth of cities and provinces in The Mekong Delta from 2010 to 2017. The Scientific Journal of Tra Vinh University 2020; 1(4):115-128. . ;:. Google Scholar
- Phetsavong K, Ichihashi M. The impact of public and private investment on economic growth: evidence from developing Asian countries. IDEC Discussion paper 2012, Hiroshima University, 2012. . ;:. Google Scholar
- Bui QB. Impacts from private investment on economic growth in Dak Nong province. The University of Danang-Journal of Science and Technology 2018; 8(129): 28-31. . ;:. Google Scholar


